Key Bitcoin Charts and Indicators Every Investor Needs

Raw data and never-ending numbers can be difficult, or even boring, to conceptualize even for the cryptocurrency investors who are very prominent in the market already. but there’s no reason to rush through or skip any crucial research or analysis steps. There are some key bitcoin charts and indicators every investor needs to simplify these tasks, whilst also giving a much more tangible picture of the movement of the price of bitcoin (this does also apply to other cryptocurrencies). Essentially, these tools do the “dirty work”, providing a stable analysis foundation, and making it easier to understand and recognize individual patterns from visual representation.
When it comes to entering successful trades being able to accurately read charts is important. Therefore, it is worth investing time in your knowledge of graphs and how to properly use them. We have added the most important bitcoin diagrams throughout this article to help with this.
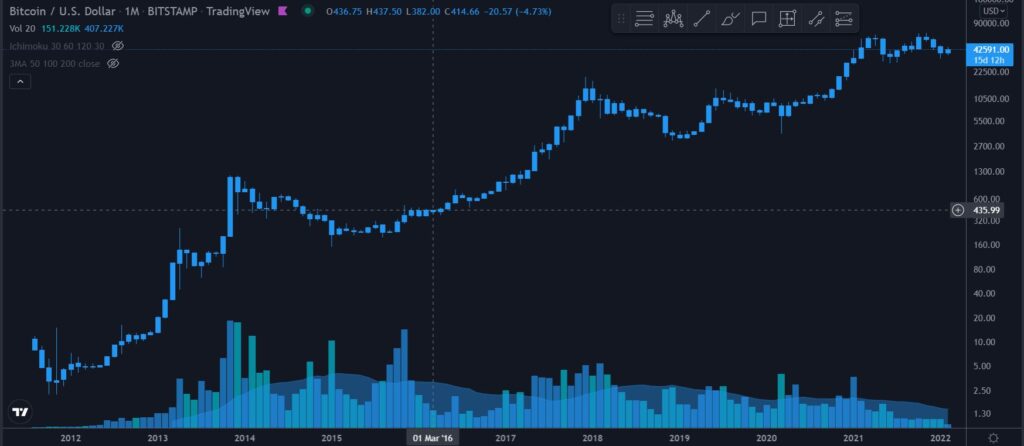
Bitcoin’s Logarithmic Regression Model
Linear and logarithmic graphs are no longer new to most stock market traders, and since they are used by them, we have probably already encountered these models.
The logarithmic graph is based on a short, concise change in the exchange rate, in percentage form. The model shows the evolution of bitcoin’s price over the past ten years on a logarithmic scale: every “bubble” that bursts and every cycle that ends with a new historical high can be easily read from it.
As for linear graphs, they are not really suitable for price analysis of exponentially growing assets, since the model is highly distorted. Therefore, if we are looking at the analysis of the price movement of cryptocurrencies, it is worth looking at logarithmic models, since we can easily mislead ourselves or draw inaccurate conclusions by using them.
To find out more about the difference between these two types of chart format, check out Investopedia’s article which gives more of an indepth comparison.
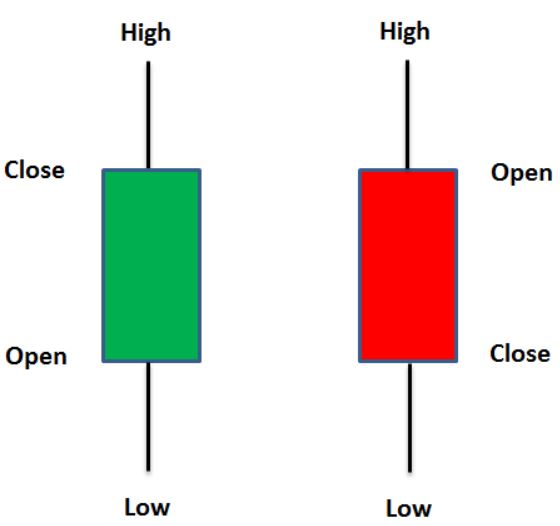
Bitcoin charts and indicators -The Candlestick Chart; A Common Preference
One of the oldest charts known to stock traders, candlestick charts allow us to more easily assess the possible outcome of price movements. This type of chart format allows us to analyse trends and establish probabilities when observing the market. Candles practically wrap around bitcoin’s opening and closing prices, as well as showing its highest and lowest prices within a given time. It would be a good idea to pay close attention and focus on the lowest possible time frame when analyzing a chart of this format. You should pay attention here because in many cases we are unable to see some information regarding the market, such as what happens between opening and closing. Therefore, when using this type of chart, it is advisable to take into account several different models and indicators.
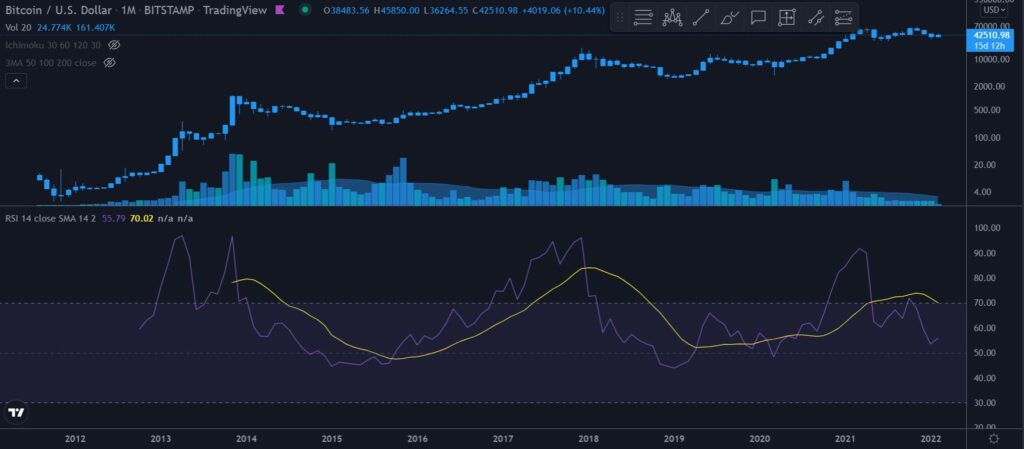
RSI – The Relative Strength Index
The RSI generally intends to predict the expected rise and fall in the exchange rate, and the graph also shows support and resistance levels, which are worth watching. However, you will more often hear about support and resistance. This is because most analysts rely heavily on the graph breaking through supports or resistance as strong indicators of another price peak or low occurring, respectively.
Therefore the RSI shows the strength of a given protocol in relation to itself and measures the ratio of the given exchange rate movement as a percentage. If the strength of the index hits 70, you would expect the exchange rate to reach one of its peaks, or the exchange rate will show a downward trend; However, if it falls below 30, an increase is likely. Overall, RSI is a forward-looking indicator, and if you observe it carefully, you can quite easily get information about an asset’s future performance projections.
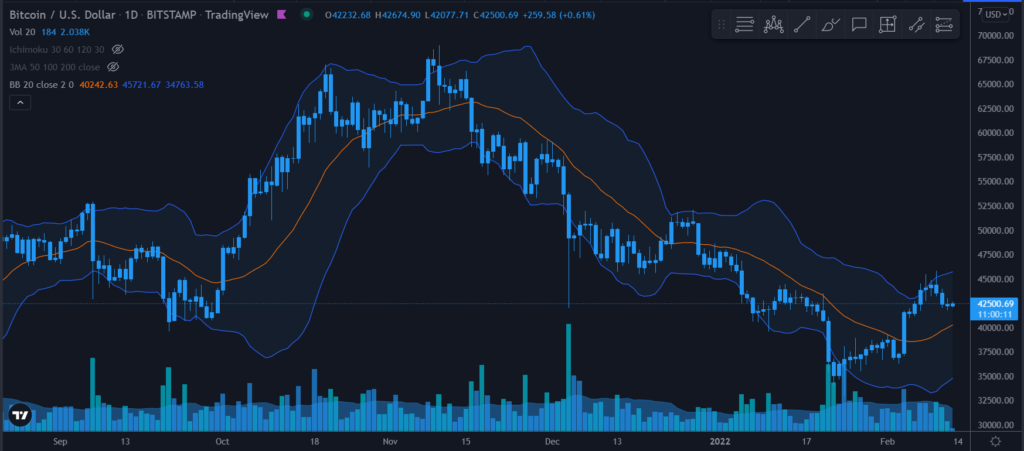
Bollinger Bands – The Bollinger Tape Indicator
It is perhaps one of the most popular indicators among analysts, which is essentially based on the volatility of exchange rates and reacts extremely quickly to the movement of the price of a particular protocol, stock or cryptocurrency. High volatility causes the tape to expand, which is otherwise divided into three sections: middle, top and bottom. However, when using this it is worth using other technical signals also, if you want to be able to see more accurate, forward-looking signals.
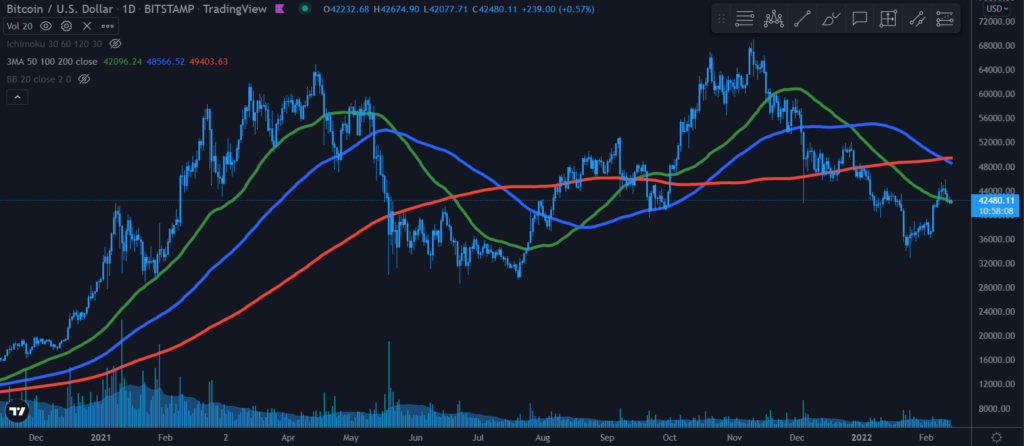
MA – The Moving average
If you are familiar with the majority of different indicators out there, you have most likely already come across the MA. It won’t be surprising if you have, as it is fairly simple to operate. It allows you to get information through the average exchange rate of any given period: you can use any moving average, whether it’s 14 days or 141 days. However, keep in mind that since the moving average draws observations from past data, it isn’t all that reliable when calculating data on future expectations.
MVRV – Market Value to Realised Value
The term HODL (Meaning ‘to hold onto and not sell any positions in a given asset despite what market movements show’) – a golden rule to most bitcoin believers – plays a significant role here. When the exchange rate reaches a level where an investor it is worth selling there positions, they easily sell and give up their cryptocurrency – this is known as realized value.
The MVRV number shows when an asset is overvalued — when the number rises — or is undervalued.
LTH-SOPR for Long-term Strategies
The LTH-SOPR (Standing for Long Term Holder-Spent Output Profit Ratio – That’s quite a mouthful!) is an indicator that shows the level of profit or loss resulting from unspent outputs of Bitcoin transactions no younger than 155 days, or UTXOs*. A LTH-SOPR above 13 shows a profit, while below 1 indicates a downward trend or a loss-making investment.
*What Is UTXO? The term UTXO refers to the amount of digital currency someone has left remaining after executing a cryptocurrency transaction such as bitcoin. The letters stand for unspent transaction output. Each bitcoin transaction begins with coins used to balance the ledger. Source: Investopedia
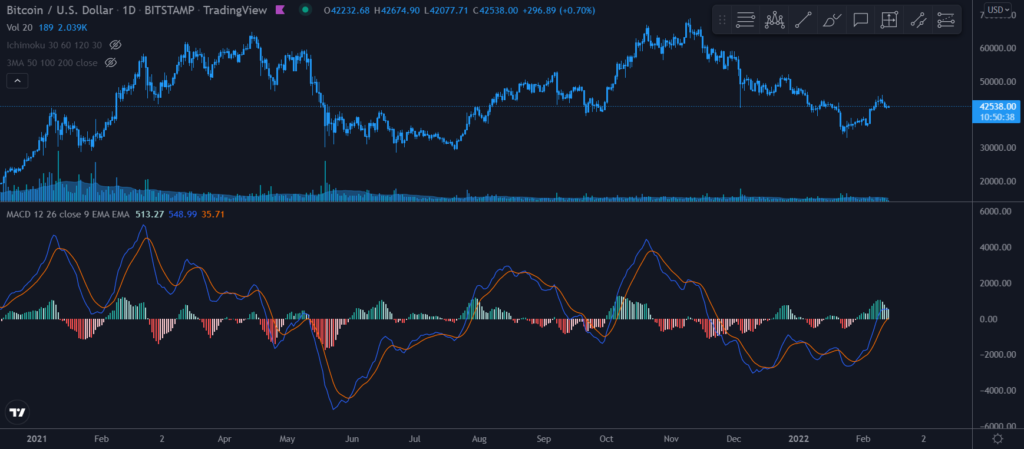
MACD – Moving Average Convergence/Divergence
The technical analysis indicator shows the extent of the exchange rate change, as well as the momentum perceived by the trends and its future durability. It monitors the movement of the exchange rate for a short period of time and draws conclusions from it. That’s why it’s less useful when it comes to looking at the price of assets that move without a trend – fortunately, cryptocurrencies aren’t like that.
TVL – Total Value Locked
This indicator will show how much interest there is in a particular asset or DeFi protocol. It also provides an excellent opportunity to compare two cryptocurrencies, or their possible vision. Of course, the larger the TVL of the given protocol, the more interest there is around it, and the more worthwhile it would be to consider trading with it.
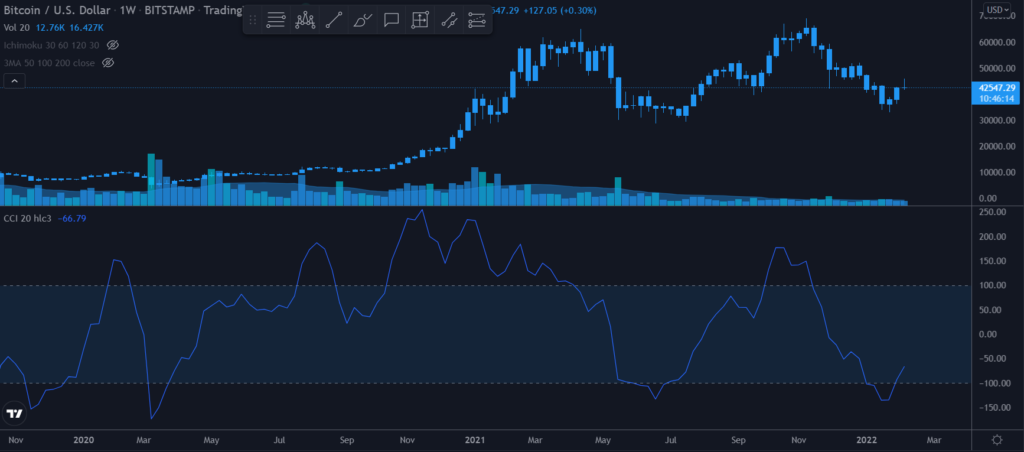
CCI – Identification of cyclical rounds
This indicator was developed in 1980 and since then its use has been identifying cyclical turns. It takes into account the cyclical movement of specific devices. If the CCI exceeds the top +100, an increase is expected in the market, and if it moves to the bottom -100 line, we can expect a rain trend. In order to get an accurate forecast, it is worth using a 10- and 30-day time band, from which we can filter out whether the exchange rate is at an extreme high or even a depth compared to the previous period.
MoE or SoV, which one is it?
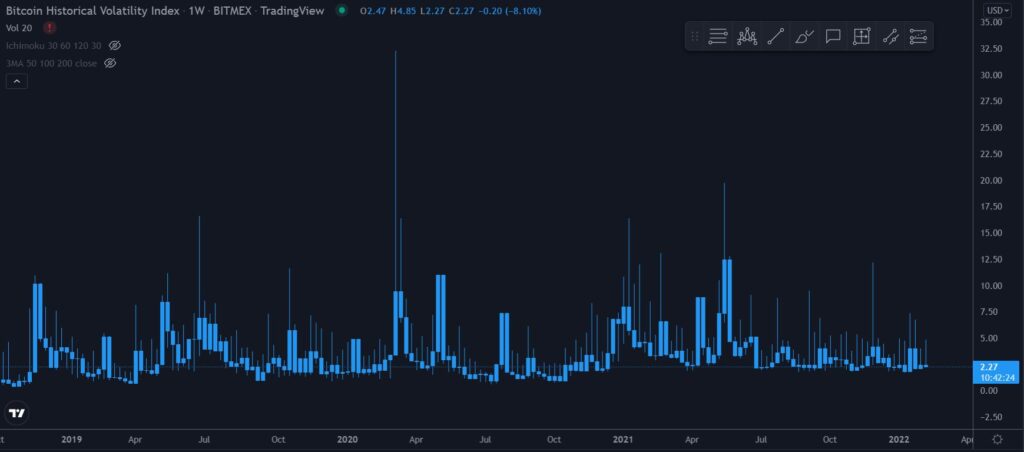
All sorts of rumors about Bitcoin are written in two different tones: they refer to our beloved cryptocurrency as either a Medium of Exchange (MoE), which is something with a value which is agreed upon among peers, or a Store of Value (SoV), essentially meaning a treasury. Many believe that Bitcoin should first act as a store of value before it takes over the U.S. dollar. Many stock market investors base their aforementioned thinking on bitcoin volatility, since a currency that can drop as much as 30 percent in a matter of seconds is not generally considered suitable as a medium of exchange. It’s seen as being too risky, impractical, not to mention the possibility of even bread prices changing daily. It is of general consensus that volatility needs to be reduced before Bitcoin can reach MoE status.
The good news is that the graph below shows a downward trend in volatility. This is possible as Bitcoin becomes more valuable and it becomes more and more difficult to move the exchange rate. In 2021, we reached a market capitalization of $1 trillion, which is an undeniably nice result compared to the $11 trillion market capitalization of gold built up over a long period of time. From now on, the sky is the limit.
The operation of DeFi protocols differs and corresponds to the interpretation of each exchange item at the same time. In the case of price-to-sale ratio, for example, we take market capitalization instead of prices and divide it by revenue.A special form of observation is the number of addresses that have interacted using the respective token, which essentially shows the acceptance of that token. But whether it’s the indicators mentioned above or other more well-known analyses, it’s worth considering several indicators at once, given the recent “demise” of PlanB’s S2F model.
Learn more about investing, trading and diversification.
Buy cryptocurrency quickly and easily in as little as 10 minutes.