BINANCE – A CRYPTO EXCHANGE ANALYSIS – Binance Review

Binance Review

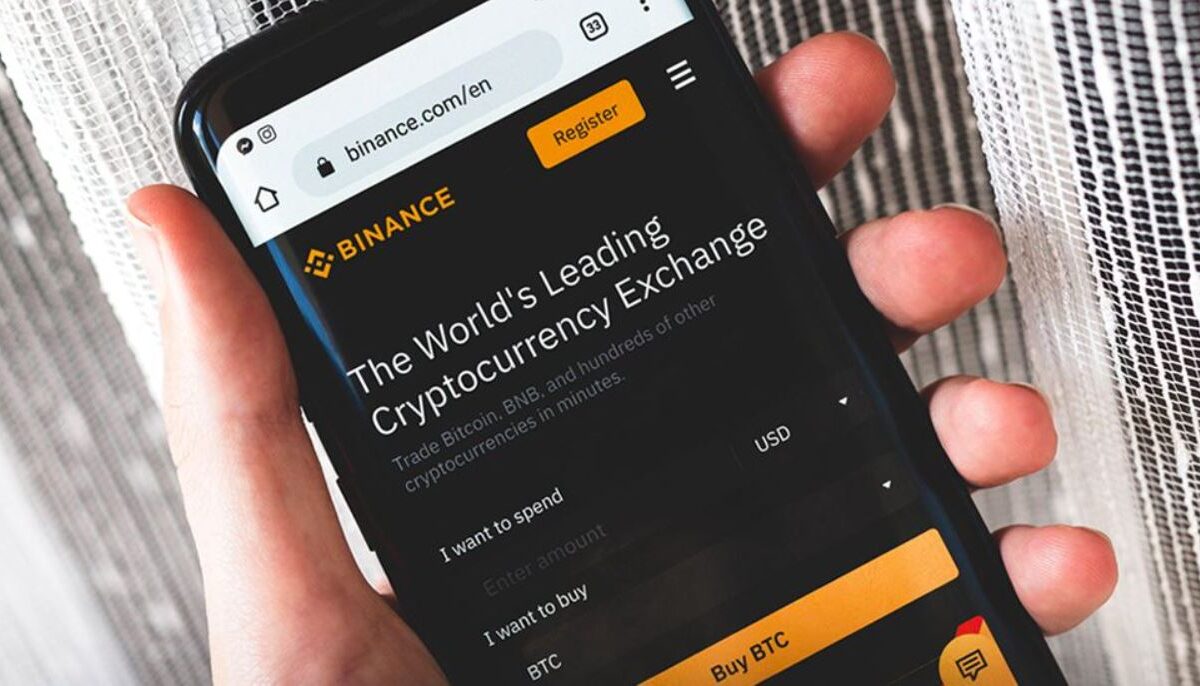
Binance Review, Binance is a cryptocurrency exchange that was founded in Hong Kong in 2017, and has rapidly grown into the world’s largest crypto exchange based on trading volume. The initial growth and popularity of the platform were so impressive that they had to temporarily suspend registrations in January 2018 so that they could keep up with demand. Today, it offers customers a highly well-established range of more than 40+ fiat currencies and 300+ cryptocurrencies with no deposit fees and highly competitive trading fees (up to 0.1%), all of this applies worldwide – where applicable.

The most important features and benefits of Binance

It has so many features that make it one of the most popular crypto exchanges in the world. Here’s a list of Binance’s best features:

  • Extremely low 0.1% fees, with discounts if you pay with BNB;
  • More than 300+ different cryptocurrencies for purchase, sale or trade;
  • Android and iOS mobile apps are available;
  • Advanced, classic and basic trading platforms to suit your needs
  • Do more with Binance Earn – increase your crypto;
  • Binance Visa Card – spend your cryptos anywhere with a card
  • P2P exchange – trade directly with others on your own terms
  • Binance Loan allows users to borrow crypto
  • NFT marketplace for buying and selling NFTs
  • Margin trading with leverage of up to 10x
  • Futures and derivatives trading

BINANCE REGISTRATION

What services does Binance offer?

If you’ve done some research on the best crypto exchanges, you’ve probably found that there are many options, making it difficult to decide which exchange platform to choose. With this in mind, we’ll help you work out the suitability of Binance by explaining the best services it has to offer to see if this is the right exchange for you.

More than 300+ different cryptocurrency purchases, sales or trades

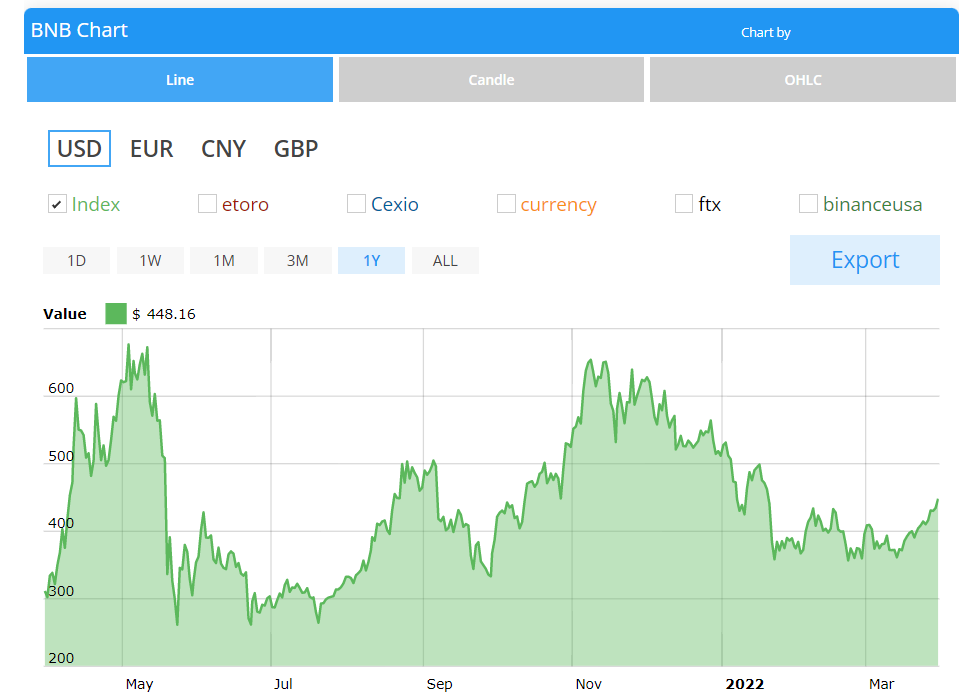
Binance offers over 300+ different cryptocurrencies, making it one of the most comprehensive offerings in the world. As the world’s largest cryptocurrency exchange based on trading volume, you know liquidity will be high, so you will be able to buy and sell (almost)any coin on their platform with ease. The native token here is Binance Coin (BNB).

Below are the latest figures:

Binance Review,
$BNB Chart

Android and iOS mobile apps

Binance has an excellent application, making everything easy for beginners. The ease that this platform affords its users also suits advanced traders by simplifying processes. Within their corresponding app, there are two versions that you can switch between at the touch of a button, these are as follows:

There is Binance Lite, which is excellent for beginners, and Binance Pro, which gives you access to many advanced features and trading tools. Further to this, according to the Google Play store, the app has more than 10 million downloads, with a high user rating of 3.7/5 stars – This rating is based on 617,000 user reviews.

Advanced, classic and basic trading platforms

Binance serves customers of all levels, from complete beginners to experienced day traders in the crypto investing world. If you want the easiest way to buy crypto, you only need to select the basic “Convert” option, which creates a straightforward interface.

Those who are more comfortable with the traditional market interface can choose the Classic method of buying crypto, which has much more information than the basic version. Experienced traders who want full access to all trading instruments can choose the Advanced option under the Trade tab.

Use Binance Earn to grow your crypto portfolio

Binance offers users various options to increase their crypto while leaving it on the stock exchange. If you plan to hodl (withhold/hold onto) your crypto, this is a potential investment opportunity. Instead of it lying dormant as available funds in your portfolio, you can work with it. The following sections below, explain the different bidding options.

Binance Visa Card

Binance works with Visa to offer a card that lets you spend your crypto with 60 million merchants worldwide. In addition, the card is free, has no administration or processing fees, and you can even get up to 8% cash-back on eligible purchases! This is undoubtedly a significant step in the right direction to make crypto a mainstream payment method.

P2P Replacement

Binance offers a peer-to-peer exchange that allows users to trade cryptocurrency directly with each other between their portfolios, on their own terms – in virtually any country!

Binance Credit

Anyone registered as a Binance user can access a loan if they wish to take one out on the platform. There are several credit conditions that you can choose from when borrowing; It is possible to make an early repayment and pay only for borrowed hours. The interest rate is calculated at 0.001667% (0.04%/day) per hour.

NFT Marketplace

NFTs have taken the crypto world by storm and are continuously gaining popularity. Binance has seized the opportunity to take part in the movement. Binance has its own NFT marketplace, where NFTs can be minted, bought and sold.

Margin trading with leverage of up to 10x

Margin trading is only available for a select few trading pairs; further to this, with some trading pairs, users can acquire leverage as high as 10x. Cross margin trading can be hazardous as users risk their entire account, while isolated margin trading only poses a risk to that trading pair.

Futures and Derivatives Trading

A relatively new feature is Binance Futures, which allows users to speculate on the price of Bitcoin and altcoins such as Ethereum, Ripple, Litecoin, Bitcoin Cash and others. When trading futures, users do not actually buy or sell cryptocurrencies, but only take advantage of the price rise/fall to make money.

The futures interface is very similar to the trading platform itself. The only difference is features, such as the ability to view open positions and features that allow traders to control leverage. Binance Futures fees are up 0.04% for each trade. Fees are lower for traders with a huge monthly trading volume or, subsequently, if their trades often increase liquidity in the order book before they are executed.

Binance awards

It has extremely low fees, and it is in fact possible for them to be reduced further.

Deposit fees

If you put cryptocurrency in Binance, there is a zero fee. If you deposit fiat currency into Binance, the fee will vary depending on how you deposit and the currency. For example, if you pay Australian dollars (AUD) using PayID/OSKO, it’s free. However, if you deposit Hong Kong dollars (HKD) by credit card, the fee is 3.50%.

Payment Fees

The withdrawal of cryptocurrency from the Binance account comes with a flat fee that covers the transaction costs of transferring crypto to the wallet. The fee varies depending on each coin. In the case of fiat currency withdrawals, the fee varies depending on the withdrawal method and currency. For example, taking the Australian dollar (AUD) by bank transfer is free. Paying the pound sterling (GBP) by credit card comes with a 1% fee.

Transaction Fees

Fees for spot trading (buying and selling cryptos) start at a low 0.1% and you can get a 25% discount if you pay the fees with Binance’s own coin (BNB). This means that you only pay 0.075% for each trade!

Trading Fees Compared to Other Popular Exchanges

Binance – 0.075%

KuCoin – 0.10%

Coinbase – 4.5%

Bybit – 0.10%

If you’re a large-scale trader and hold a lot of BNB tokens, you can reduce fees even further, with the lowest fees with a 0.015% maker fee and a 0.03% taker fee, including a 25% discount using BNB.

Binance security

As a platform, Binance is a secure cryptocurrency exchange that keeps most of its digital assets offline in cold storage and also gives its users tips on ways to increase security. In line with their strong security ethics, there are account settings to enable 2FA (two-factor authentication), the whitelisting of devices, payment address management, the enablement of anti-phishing codes, and even U2F (universal factor 2 authentication) – which requires physical access to hardware to access the account.

Despite all of these efforts to keep the exchange safe in 2019 Binance fell victim to a cybersecurity breach and lost more than $40 million worth of Bitcoin. However, they reacted commendably to the situation; The resulting losses were fully subsidised and so users did not suffer any actual losses. Four months after the incident, they received ISO 27001 certification after passing an audit of information security management. This shows how committed Binance actually are to maintaining a secure platform for all customers. Further to this, Binance is constantly investing in ways to improve their cybersecurity protection.

Summary

In the world of cryptocurrency, Binance is certainly a big and popular name, this is no  accident. Based on trading volume, it is the largest crypto exchange with competitive fees and a platform designed for both novice investors and experienced traders. With over 300 different coin offerings and extra features like bets, margin trading, futures, and even an NFT marketplace, it’s an excellent platform to rely on for your blockchain activities.

Don’t have an account of your own? If you want to open one follow the link to get started: 

Binance registration >>

Read more analysis from us here

Key Bitcoin Charts and Indicators Every Investor Needs

Key Bitcoin Charts and Indicators

Raw data and never-ending numbers can be difficult, or even boring, to conceptualize even for the cryptocurrency investors who are very prominent in the market already. but there’s no reason to rush through or skip any crucial research or analysis steps. There are some key bitcoin charts and indicators every investor needs to simplify these tasks, whilst also giving a much more tangible picture of the movement of the price of bitcoin (this does also apply to other cryptocurrencies). Essentially, these tools do the “dirty work”, providing a stable analysis foundation, and making it easier to understand and recognize individual patterns from visual representation. 

When it comes to entering successful trades being able to accurately read charts is important. Therefore, it is worth investing time in your knowledge of graphs and how to properly use them. We have added the most important bitcoin diagrams throughout this article to help with this.

Bitcoin’s Logarithmic Regression Model

Linear and logarithmic graphs are no longer new to most stock market traders, and since they are used by them, we have probably already encountered these models.

The logarithmic graph is based on a short, concise change in the exchange rate, in percentage form. The model shows the evolution of bitcoin’s price over the past ten years on a logarithmic scale: every “bubble” that bursts and every cycle that ends with a new historical high can be easily read from it.

As for linear graphs, they are not really suitable for price analysis of exponentially growing assets, since the model is highly distorted. Therefore, if we are looking at the analysis of the price movement of cryptocurrencies, it is worth looking at logarithmic models, since we can easily mislead ourselves or draw inaccurate conclusions by using them.

Bitcoin Charts and Indicators
Bitcoin 10 years log chart

To find out more about the difference between these two types of chart format, check out Investopedia’s article which gives more of an indepth comparison.

Bitcoin charts and indicators -The Candlestick Chart; A Common Preference

One of the oldest charts known to stock traders, candlestick charts allow us to more easily assess the possible outcome of price movements. This type of chart format allows us to analyse trends and establish probabilities when observing the market. Candles practically wrap around bitcoin’s opening and closing prices, as well as showing its highest and lowest prices within a given time. It would be a good idea to pay close attention and focus on the lowest possible time frame when analyzing a chart of this format. You should pay attention here because in many cases we are unable to see some information regarding the market, such as what happens between opening and closing. Therefore, when using this type of chart, it is advisable to take into account several different models and indicators.

candlestick chart
candlestick chart

RSI – The Relative Strength Index

The RSI generally intends to predict the expected rise and fall in the exchange rate, and the graph also shows support and resistance levels, which are worth watching. However, you will more often hear about support and resistance. This is because most analysts rely heavily on the graph breaking through supports or resistance as strong indicators of another price peak or low occurring, respectively.

Therefore the RSI shows the strength of a given protocol in relation to itself and measures the ratio of the given exchange rate movement as a percentage. If the strength of the index hits 70, you would expect the exchange rate to reach one of its peaks, or the exchange rate will show a downward trend; However, if it falls below 30, an increase is likely. Overall, RSI is a forward-looking indicator, and if you observe it carefully, you can quite easily get information about an asset’s future performance projections.

bitcoin relative strength index
relative strength index

Bollinger Bands –  The Bollinger Tape Indicator

It is perhaps one of the most popular indicators among analysts, which is essentially based on the volatility of exchange rates and reacts extremely quickly to the movement of the price of a particular protocol, stock or cryptocurrency. High volatility causes the tape to expand, which is otherwise divided into three sections: middle, top and bottom. However, when using this it is worth using other technical signals also, if you want to be able to see more accurate, forward-looking signals.

bitcoin boilinger bands
Boilinger Bands

MA – The Moving average

If you are familiar with the majority of different indicators out there, you have most likely already come across the MA. It won’t be surprising if you have, as it is fairly simple to operate. It allows you to get information through the average exchange rate of any given period: you can use any moving average, whether it’s 14 days or 141 days. However, keep in mind that since the moving average draws observations from past data, it isn’t all that reliable when calculating data on future expectations.

bitcoin Moving averages
Moving averages

MVRV – Market Value to Realised Value

The term HODL (Meaning ‘to hold onto and not sell any  positions in a given asset despite what market movements show’) – a golden rule to most bitcoin believers – plays a significant role here. When the exchange rate reaches a level where an investor it is worth selling there positions, they easily sell and give up their cryptocurrency – this is known as realized value.

The MVRV number shows when an asset is overvalued — when the number rises — or is undervalued.

LTH-SOPR for Long-term Strategies

The LTH-SOPR (Standing for Long Term Holder-Spent Output Profit Ratio – That’s quite a mouthful!) is an indicator that shows the level of profit or loss resulting from unspent outputs of Bitcoin transactions no younger than 155 days, or UTXOs*.  A LTH-SOPR above 13 shows a profit, while below 1 indicates a downward trend or a loss-making investment.

*What Is UTXO? The term UTXO refers to the amount of digital currency someone has left remaining after executing a cryptocurrency transaction such as bitcoin. The letters stand for unspent transaction output. Each bitcoin transaction begins with coins used to balance the ledger. Source: Investopedia

MACD – Moving Average Convergence/Divergence

The technical analysis indicator shows the extent of the exchange rate change, as well as the momentum perceived by the trends and its future durability. It monitors the movement of the exchange rate for a short period of time and draws conclusions from it. That’s why it’s less useful when it comes to looking at the price of assets that move without a trend – fortunately, cryptocurrencies aren’t like that.

bitcoin MACD
MACD

TVL – Total Value Locked

This indicator will show how much interest there is in a particular asset or DeFi protocol. It also provides an excellent opportunity to compare two cryptocurrencies, or their possible vision. Of course, the larger the TVL of the given protocol, the more interest there is around it, and the more worthwhile it would be to consider trading with it.

CCI – Identification of cyclical rounds

This indicator was developed in 1980 and since then its use has been identifying cyclical turns. It takes into account the cyclical movement of specific devices. If the CCI exceeds the top +100, an increase is expected in the market, and if it moves to the bottom -100 line, we can expect a rain trend. In order to get an accurate forecast, it is worth using a 10- and 30-day time band, from which we can filter out whether the exchange rate is at an extreme high or even a depth compared to the previous period.

Bitcoin CCI
CCI

MoE or SoV, which one is it?

All sorts of rumors about Bitcoin are written in two different tones: they refer to our beloved cryptocurrency as either a Medium of Exchange (MoE), which is something with a value which is agreed upon among peers, or a Store of Value (SoV), essentially meaning a treasury. Many believe that Bitcoin should first act as a store of value before it takes over the U.S. dollar. Many stock market investors base their aforementioned thinking on bitcoin volatility, since a currency that can drop as much as 30 percent in a matter of seconds is not generally considered suitable as a medium of exchange. It’s seen as being too risky, impractical, not to mention the possibility of even bread prices changing daily. It is of general consensus that volatility needs to be reduced before Bitcoin can reach MoE status.
The good news is that the graph below shows a downward trend in volatility. This is possible as Bitcoin becomes more valuable and it becomes more and more difficult to move the exchange rate. In 2021, we reached a market capitalization of $1 trillion, which is an undeniably nice result compared to the $11 trillion market capitalization of gold built up over a long period of time. From now on, the sky is the limit.

BTC historical volatility

The operation of DeFi protocols differs and corresponds to the interpretation of each exchange item at the same time. In the case of price-to-sale ratio, for example, we take market capitalization instead of prices and divide it by revenue.A special form of observation is the number of addresses that have interacted using the respective token, which essentially shows the acceptance of that token. But whether it’s the indicators mentioned above or other more well-known analyses, it’s worth considering several indicators at once, given the recent “demise” of PlanB’s S2F model.

Learn more about investing, trading and diversification.

Buy cryptocurrency quickly and easily in as little as 10 minutes.

How Investment Diversification Reduces Financial Risk

investment diversification

Diversification is fundamental for sound investment portfolios. Yet, despite the importance of investment diversification, its meaning remains vague for many. When wealth building, it is important to strive to reduce the level of risk in your portfolio.

This article aims to aid your learning of how to begin minimising risk while your savings increase. Let’s get started!

What is diversification?

The essence of diversification is the reduction of losses by spreading the risk burden.

Let’s say you collect an amount of physical capital, and you now want to invest that money. 

How do you go about investment diversification?

You read an article online that says how particularly well a technology company is doing at this moment in time. After reading the article, you decide to invest all of your money in shares of that single company. Then, when they release the quarterly report, it shows they never reached their projections, and the exchange rate starts falling sharply. Now roughly 40% of your invested capital is already absorbed, and you face losing everything, should the share price continue to plummet. 

An alternative situation to the scenario mentioned above would be that you seek out some level of professional advisory.

investment diversification

Nine out of 10 experts are likely to recommend buying a bigger multiple of, preferably, different products instead of just several smaller ones that are all similar to eachother. 

To create such a portfolio, for example, you would buy a smaller real estate unit, as well as government securities, bonds and shares. It would even be possible to further add more investment assets different to these ones. By building your portfolio like this, you would be able to spread the risk, therefore reducing how much is held in each asset. And if the value of one asset decreases (Like with the stock price we used as an example previously), then only a smaller portion of your entire wealth is lost, because only a small percentage loses its value. This is what diversification is.

You can read about the basics of investing here

Why is diversified investment important?

As we have said, the aim of diversification reducing the risk of investment. As long as you keep your total capital in only one investment vehicle, there is a chance that you will suffer a significant loss as a result of an unfortunate event. 

Economic processes are constantly changing and, therefore, so is the value of all the different assets. As a result, crises come and go – during which the value of various investment vehicles can fall significantly.

But on top of that, many things can affect their value. For example, a high-value property is still just a building and can become badly damaged (House fire) or even the quality of the property’s surrounding area, both of these reasons, and many more, can cause the property value to depreciate. Your money invested in the shares of an IT company could easily fall because of the scandal surrounding the company. And, further from this, your bonds can be devalued more or less overnight. Moreover, unfortunately, there have been cases in recent years when the issuing financial institution has become insolvent (not able to repay owed debts – bankrupt).

Read more about Why Depreciation Is The Biggest Perk Of Real Estate Investing

Although these examples seem to be extreme, over the last few years such stories could be read in credible news outlets. Unfortunately there will be more cases of this nature heppening in the likely not-too-distant future. Therefore it’s better not too underestimate the chance of such situations occurring.

In the case of a varied portfolio, usually only a small part of your assets will be in threat at any given time This makes having a diversified portfolio is moderately risk-reducing.

How does diversification work?

The most important rule of diversification is to invest in assets whose exchange rate movements don’t correlate. That is, the fall in the exchange rate of one asset class does not cause a negative change in the other.

Let’s say, hypothetically, you put 40% of your savings into an investment fund with high-risk technology stocks, and 60% into a low-risk sovereign debt or bond mutual fund. Thus, fluctuations in the price of high-risk stocks will not have such an impact on your overall savings. 

By putting your money into mutual funds, you are diversifying on your own, because you are not putting everything on one company, but on, say, 60-70. So of course, here it is also worth carefully exploring the characteristics of the investment vehicle.

What should you pay attention to when building a diversified portfolio?

When developing a diversification strategy, think primarily about:

  • What are individual goals?
  • Do you want to invest regularly or in one lump sum?
  • How much return do you expect?
  • How long do you want to invest?
  • How much risk are you willing to take?

Do you need a flexible, disbursable**, easy-to-monetize (liquid) form of investment from which you can quickly withdraw your money if necessary? Or do you have more of a long-term reserve that you won’t expect to touch for years?

Each investment vehicle has its own characteristics. The goal is not to have money everywhere, but to divide it into a percentage of different options, thus reducing the risk. 

**able to be distributed or scattered – definition source here

Why is diversifying important?

In the world of investments, there is a rule of thumb: the risk taken is proportional to the level of return. So, on the other hand, a low-risk government bond will also give a low yield. But, due to the low risk of the government bond, the returns are more or less guaranteed. Exceptions to this would include; the bankruptcy of invested companies, war and economical collapse(recession).

A newly listed company with high expectations from investors promises high returns. However, bad political or economic news can be enough to cause a stock’s value to fall by 20-30%.

This shows that it is worth diversifying our investments primarily on the basis of risk levels. On a scale ranging from low-risk investments to extremely risky assets, you need to choose the forms you’d like to invest in. Of course, it is worth combining the different risk assets in certain proportions that are relevant to your overall strategy.

What major asset classes can you invest in?

Government securities

Government securities are one of the simplest, least risky forms of investment. When you buy government securities, you essentially “lend” your money to the state, that is, you get a state guarantee. Low risk is accompanied by low returns.

Bonds

A bond differs from government securities in that you don’t “lend” your assets to the state here. Instead, they’re “loaned” to a financial institution or company, and for a fixed period of time. The risk is higher here too since, in this case, it is more possible for a company or financial institution to become insolvent(unable to pay arrears in any case). In addition, the so-called exchange rate risk is to be taken into account, which is due to the change in the value of the given bond. The higher the yield on a bond, the riskier it is.

Shares

When you buy shares, you acquire a small slice of the ownership of a particular company. This investment vehicle is an extremely high-risk asset, which should only be considered if you have good market research, market experience or – if you are more inexperienced than most – are prepared to potentially experience losses within some of your trades.

Read about market risk here

Property

A real estate investment is one of the so-called illiquid investments. This means that it is difficult to exchange a property for cash. Buying and selling a property, or even renting it, takes longer, so if you need money quickly at any time, real estate is not the best way to invest your property. In the case of long-term financial plans, however, this is an excellent asset to have. For this type of investment, the risk is moderately high, but the time and capital requirements can be significant. – despite this, if you are renting your unit out, this will easily make a return for you as a more passive income.

Foreign currency

Foreign exchange investment is one of the most skilled investment vehicles, because of this the risk management required is high. This method isn’t recommended for beginners under any circumstances.

Read our article about Forex

Commodity products

In investment terminology, naturally occurring raw materials used in different industrial sectors are referred to as commodity products. Examples of commodities would be gold and oil. In addition to foreign exchange trading, this is the other group of investment assets that requires a higher level of expertise and large time expenditure and can be very risky.

Cryptocurrency

Virtual money has recently become a very popular investment vehicle due to its return potential. Although it should be noted that there have been numerous instances of regular, unexpected crashes and unpredictable behaviour of cryptocurrencies that you can readily find information on.

Bearing all of the above in mind, cryptocurrency trading is a particularly risky area of expertise.

The easiest way to diversify investments?

The easiest way to diversify is through investment funds. The advantage of these is that by buying a single asset, you practically put your money in a diversified portfolio. For example, with a fund, you can choose an investment fund based on geographic regions (e.g. USA, Far East, Central Europe, etc.), raw materials (gold, oil), risk, or even sector. Each fund has dozens or even hundreds of securities, which also supports diversification. 

In addition, this way you can diversify much more cost-efficiently than buying each of the securities, found in any chosen investment fund, separately. And further to the fact that these assets are completely liquid, a whole team of experts is engaged in achieving the best possible return on it. 

Putting savings in investment funds can also be solved within the framework of your pension insurance in the form of life insurance tied to investment units 

Is there such a thing as excessive diversification?

Diversification is very important in creating a balanced investment portfolio, but it can also be overdone. One of the disadvantages of excessive diversification is that the investment system can easily become overbearing for any investor. If you don’t know exactly what your money is doing and what or where losses have been made, and where to focus your attention, you may lose control of your money. 

Another downside to excessive diversification is relatively low yields. Figuratively speaking, the more legs you stand on financially, likely there will be less capital allocated to each product. This is why, most of the time, these lower yields can be expected. Not only this but, lower capital allocation also means there is less risk of you losing a large proportion of investment in one go, without diversification you could even lose everything all at once.

However, this does also mean if one asset fund generates high returns, you will benefit less from it because of the smaller amount invested than if you put a larger amount into it. 

This reduces the relative return on diversified portfolios, but in a balanced investment system, the strengthened portfolio security offsets this lower yield potential due to reduced risk, and therefore reduced losses.

Conclusion

As in other areas of life, it is very important to reduce the risk in finance and it can be detrimental to keep our savings and assets all in one place: whether it be in an account, in a bank account, or in the shares of one particular company. However, with a balanced portfolio of investments managed very carefully either by you or by experienced professionals, you can be sure that your wealth grows in the long term and provides you with financial security. 

In-depth Investing for Beginners: How Does It Help Build Wealth?

In-depth Investing for Beginners

Are you intrigued by the concept of investing and want to learn more about investments? Then you’re in the right place!

This article will present the most important investment basics, that beginners need to know. We will also look at why investing is beneficial and what you may miss out on if you don’t take advantage of it.

If you want to build wealth — either for retirement or to achieve financial freedom — usually, it isn’t enough to make money and save some of it.

As Robert Kiyosaki said,  “For every dollar you save, you can give a work suit and send it to make more money for you.”

Today, anyone can invest, with a few hundred dollars and a phone with an internet connection, anybody can get started.

However, the world of investing can seem complicated, and we often don’t know how to get started in the first place. We can find ourselves in a real sea of jargon on the Internet, where sometimes it is difficult to find the best of the available information.

Because of this, many people don’t even start investing and so, due to inflation, they continue to lose money without even realising. With the right basic knowledge, investments can be made to be much more simple.

This article will give you all of the most important information that you would need as a beginner starting out on your investment journey.

As there is a lot of information packed into this article, please see our Table of Contents below:

1) What is Investing?

1.1) 1. Cash flow / Direct income

1.2) 2. Capital gains

1.3) 3. Cash flow + Capital gains

1.4) Investment means the purchase of income-generating assets

1.5) The Difference Between Investing and Speculation

1.6) Investor Vs. Speculator

2) Why is it important to invest?

2.1) Why is it not enough to save?

2.2) Build Wealth With the Power of Interest

3) When should you start investing?

4) Misconceptions about investing

4.1) Myth 1: Investing is Difficult/ Complicated

4.2) Myth 2: The Luck of Investing

4.3) Myth 3: It Takes a Lot of Money to Invest

4.4) Myth 4: Only The Rich and Professionals Can Invest

5) Investment Funds

5.1) 1. The Main Asset Classes

5.2) 2. The Correlation between Return On Investment (ROI) and Risk Exposure

5.2.1) High Yield, Low Risk?

5.3) 3. Diversification

5.3.1) Think in portfolio

5.3.2) ETFs: One of the Best Tools for Diversification

6) Investment Concept: Summary

What is Investing?

By investing, we mean a long-term process of buying income-generating assets with the aim of earning a return from it in the future.

Self-made money-man Warren Buffett once said:

“Investing is giving up today’s consumption in order to consume more later.”

Where does the return / gain come from?

It can come from three different sources, as explained below, where we will use examples to illustrate the given point:

1. Cash flow / Direct Income

Example #1: When you invest in a company’s shares, you actually become one of its shareholders.

As incredible as it is, when you buy an Apple share, for example, you’ll be a part-owner of the company, even if you’re going to own only a fraction of the shares issued. 

From the profits generated by Apple, you, as a co-owner, receive dividends on your shares every quarter.

Example #2: If you invest in a property and rent it out, you’ll get a monthly wage fee in return, in the form of the rent you receive from your paying tenants.

2. Capital gains

The prices of both shares and property can rise, from which you can achieve capital gains.

Example: If Apple performs well, the price per share will increase. Let’s assume you bought an Apple stock for $100, which later increased to $150. In this case, you would have made a total capital gain of $50.

3. Cash flow + Capital gains

For many investments, you can get your returns from both sources. In the case of shares, you can receive dividends (although not all companies will pay dividends) and capital gains.

In the case of real estate investment, in addition to the monthly wage fee, the price of your property may also increase.

Investing Means Buying Income-Generating Assets

It’s no coincidence that we highlighted “income-generating” assets above. Colloquialism and the media often misuse investment as a concept.

For example, you may often hear people remarking that they have invested in a new car or a new phone.

For these purchases to be considered an investment, we must ask the following question:

Is this ‘XYZ item’ going to produce any future returns?

If the answer is no, then the new purchase is not an investment at all but instead is known as an ‘obligation’. This is because it may incur maintenance costs, but in turn won’t subsidise the user for these costs in any way, meaning they will be out of pocket.

Another thing to consider in this case is that the item’s value is also constantly depreciating (falling).

As we have said, buying a car for personal use is not an investment; it is a cost. But this can be changed if, for example, you were to start a courier company from which the vehicle will become a means for you to earn from.

Contrary to popular belief, trading, Forex and cryptocurrency purchases aren’t actually considered to be investments. Instead, these are officially known as speculations.

The Difference Between Investing and Speculation

Despite there being critical differences between these two concepts, it can be difficult for beginners to distinguish between the two, this is also true for those who are more experienced.

According to the world-renowned investor, Philip Carret:

“The man who bought United States Steel in 1915 for $60 to profit from the sale at a higher price is a speculator. In contrast, the gentleman who bought American Telephone to get a dividend yield of more than 8% is the investor.”

Carret also, quite concisely, said the following:

“Speculation is the purchase and sale of securities or commodities merely in the hope of profiting from their exchange rate fluctuations.”

As one of the greatest investors of all time, Warren Buffett’s example reflects the difference between speculation and investment:

“There are two types of devices that can be purchased. One is where the asset itself generates returns for you, such as rental properties, shares, or a farm. And then there are devices that you buy in the hope that later someone will pay more for them, but the devices themselves will not produce anything for you. I think the second is speculation.”

Our take-away from this is an investor thinks in the long-term and buys an asset because of its future cash flow. Here the assets primary purpose is to keep your invested capital safe while achieving adequate returns simultaneously.

Opposite to this, a speculator buys a particular asset merely in the hope that its price will increase (or fall) due to market sentiment, regardless of whether the fundamental value of the underlying asset has changed.

Investor Vs. Speculator

The most critical differences between investment and speculation are the level of risk exposure and the certainty of retaining any invested capital.

In this case, the investor is more assured that they will not lose their money, whereas the speculator should know that there is a high probability that the investment can be lost entirely.

The problem is when a person believes they’re investing when they’re speculating, possibly causing some unexpected losses.

So, why would people speculate when they know the probability of loss is high?

The answer to this could be for the same reason that many people like to gamble – some may think speculation is exciting due to the, sometimes high-stake, risk, and that investments are boring in comparison.

To clarify, there is no issue with speculation, should you wish to put some of your capital here, but we must make the point that, if you wish to build wealth, then this might not be the best way to go about it (at least until you gain some market experience dealing with risk).

The best, most safe and proven way to build wealth for a beginner may be to invest.

In the world of personal finance, the general consensus is to never speculate more than 5% of your total wealth.

Why?

In the event that you lose everything that has a high-risk probability, it won’t have a big impact on your financial situation due to your other portfolio assets.

Why is it important to invest?

Since investments also involve certain risks, from time to time the question of whether it is really worth investing in the first place may arise. And, it may also be asked if there is a better alternative? Let’s look into this:

Why is it not enough to save?

Saving is the number one and most important element in achieving your financial goals, but without investing you won’t get much out of your money, depending on a number of variables.

The purchasing power of the amount held in fiat currency (Liquid cash) and that held in a bank account, is steadily decreasing due to inflation.

Many people don’t realise this fact. For example, if you set aside $10,000 today and don’t touch it, you will likely still see the same amount in your bank account in 20 years. The problem in this is that, due to inflation, in 20 years this amount will carry much less purchasing power. Meaning its value has steadily decreased throughout the years.

By investing, however, you can maintain the purchasing power of your money against inflation and increase it at the same time.

This is well reflected in the chart below, which shows an inflation-adjusted value (Real value) of $1 held in various assets (e.g. stocks, bonds, gold or cash in dollars) between 1802 and 2012.

It is clear that if you invested in stocks, for example, your initial $1 investment increased to $1,029,045 (above inflation!).

Conversely, if you kept your money under your pillow (DOLLAR), the initial $1 dropped to 0.051 cents due to inflation.

So you didn’t do anything, and yet you lost — you couldn’t even keep the value of your money.

Therefore, to answer the question posed at the beginning of this section: yes, where investing does involve risk, the alternative is guaranteed loss.

Build Wealth With the Power of Interest Interest

If you want to build wealth, whatever the reasoning (e.g. providing a good pension, building passive income or achieving financial freedom) – investing is necessary for achieving this goal.

You can increase your money by buying income-generating assets. You can then use the funds generated by these assets to purchase further additional assets that will, in turn, generate even more money. You can even continue to reinvest earnings infinitely if you want to build the portfolio quicker than you would otherwise be able to do so.

As Ben Franklin said, “Money that money produces, produces money.” 

Thanks to compound interest, as you continue to reinvest earned capital, your wealth will begin to grow at an ever-accelerating rate.

Read more about compound interest and use our compound interest calculator to see how much return a month / year you can make. Click Here

The following illustrates the effect of interest rates:

As you can see, over time, an increasing and larger portion of your wealth is made up of yield (part marked in purple).

By the end of the 20  years, your total wealth was about $7000, of which you only invested about $1000.

When should you start investing?

This Chinese proverb. Although it has its own applications, it is very much true for investments too:

“The best time to start planting a tree was 20 years ago. The second best time is today.”

Why is this relevant?

The earlier you start investing, the longer you can utilise the power of interest rates.

Let’s make three examples; Michael, Jennifer and Sam.

Michael started investing $95 a month at the age of 25, for 40 years until he was 65.

Jennifer began her investments 10 years later, depositing around $126 per month, for 30 years until she was 65 years old.

Sam discovered the investments very late, meaning he only started investing at the age of 45. Because she was so far behind the others, she decided to double Michael’s monthly deposit, so Sam invested $190 a month for 20 years until she was 65.

So all three invested, on average, the same amount – that is, $45,600 – all across different time horizons.

The question is, who made more?

Let’s look at:

Note: Image is for illustration purposes only and doesn’t reflect mentioned figures

Even though all three investors allocated the same amount over time, Michael was the one who ended up with the most considerable capital.

He enjoyed the power of compound interest for the longest time, so even though Jennifer and Sam invested the same amount, Michael’s money worked harder than the other invested capital amounts.

Why? Take a look at our Compound interest calculator here to see how it works for yourself!

Misconceptions about investing

Many people have certain misconceptions that will stop them from getting started altogether. So let’s begin this section by dispelling the most common misconceptions you may encounter.

Myth 1: Investing Is Difficult Or Complicated

Sometimes, the financial sector may try to overcomplicate investments in the hope that clients will be overwhelmed with all the information and will, therefore, need to make use of their advisory services.

The truth is that with just the most basic knowledge, investments become quite simple; You can acquire the basic knowledge required for it with just a few hours of learning.

Investing will always seem complicated when you don’t understand it in one way or another. But unfortunately, this is just a natural part of human psychology where a lack of understanding will be confusing.

Myth 2: The ‘Luck’ of Investing

Many people don’t invest because they have wrongly learned that investing is just the same as, if not similar to, gambling. However, certain assets, such as cryptocurrencies, do happen to be a little closer to gambling when we compare the levels of risk, which usually creates this misconception.

So what separates investment from gambling? There are many ways in which these two topics differ from each other, although here are the main three distinguishing factors of investing:

  • With your investments, you have control over the level of risk exposure, and you can also limit your level of loss. Unfortunately, in the case of gambling, you don’t necessarily have the luxury of controlling these factors, meaning you can only win or lose everything.
  • When you invest, you essentially become the owner of that particular asset, for example owning real estate or becoming a part-owner in a listed company (stocks). When gambling, you don’t own anything once you have assigned your capital to it.
  • Before investing in any particular product, there will usually be a lot of information (often decades-worth) that you can first analyse to make reasonable and informed decisions. On the other hand, gambling will often not be able to offer this opportunity beforehand

Myth 3: It Takes a Lot of Money to Invest

Depending on the paltform, you can start investing from $10 today, so this misconception is also silly.

Moreover, you can use even smaller amounts of money to build significant wealth in the long run, thanks to the power of compound interest.

However, the important thing is that you start at the earliest moment you feel ready. With this method, you can gain invaluable investor experience with smaller capital mounts, meaning you can keep overall losses to a minimum in the long term.

These experiences will come in handy later in your investment journey when you have more capital at your disposal and start to invest more. If you’re not sure why using this method is helpful, the fact is you will make mistakes when you first start. However, learning from these instances, which produce more minor losses, and being able to apply the experience gained in future situations means you will be better prepared for more considerable risk exposure much quicker.

Myth 4: Only The Rich and Professionals Can Invest

Many people believe that only the more privileged of people can invest. This couldn’t be further from the truth.

Even if this was once true, practically anyone could invest in today’s market. We can say this is regardless of age, income or professional knowledge. And as we previously stated, it can be more beneficial in the long run to you, as an investor, to begin your portfolio with smaller capital amounts.

The Investment Funds

This section will look at the most important basics that you need to know about investments.  

1. The Main Asset Classes

There are many investment options. We can classify almost all of these options into a corresponding asset class; An asset class is a group of financial instruments with similar characteristics.

A) Cash and cash substitutes (cash, T-bills, savings accounts)

This is the more simple of the groups, with the lowest risk management requirement. The primary advantage of such investments is high liquidity (immediately available or easy to convert into cash), with a maturity of up to 1 year.

Cash and bank deposits are included here, as are securities such as the Treasury-Bill (T-Bill) issued by the U.S. state, which is internationally recognised and often used as a risk-free interest rate.

B) Fixed income (bonds, government securities, bond ETFs)

It is an investment in debt securities. These are known as fixed incomes because securities offer investors a fixed interest payment within a specified period.

Fixed income is usually simply referred to as “bonds.”

C) Equity (shares, mutual funds, equity ETFs)

The term ‘equity’ derives from the fact that shares are equity securities. By investing in listed companies, we – in turn – become part-owners (or shareholders) of that company.

Through something called an ‘Exchange Traded Fund’, otherwise known as an 

ETF, we can acquire shareholdings in a pre-prepared selection of companies at once instead of deciding what companies to allocate our money to one at a time.

An example of a more popular, and more importantly, proven ETF would be the S&P 500, the US index.

D) Alternative investments

As other financial instruments are commonly referred to as “alternative investments”, Real Estate; Commodities; Forex, Hedge Funds, Private Equity, and Derivatives are included in this asset class.

2. The Correlation between Return On Investment (ROI) and Risk Exposure

One of the main principles of investment is that return and risk go hand in hand.

This means that investment opportunities offering higher returns are associated with higher risk at the same time.

In the same way, low-yield investments offer greater certainty because of their low risk.

The following chart shows the yield-risk relationship between investment opportunities within different asset classes:

Both bonds and stocks are good examples of the point that we are trying to make here.

The risk of shares is higher than that of bonds. This is due to the fact that shareholders have what are called “residual claims”. This means that when it comes to any profits a company makes, creditors are paid first and then the shareholders. Meaning that, if the company is profitable, a policyholder’s returns are guaranteed, whereas those expected by a shareholder aren’t so certainly ascertained.

Further to this, in the event that the company goes bankrupt and is liquidated, the creditors’ claims are first satisfied from the assets sold and only after this has been done – and shareholders will only be paid if there is anything left.

Meaning when the liquidation of a company does unfortunately happen, shareholders often get nothing.

As referenced earlier in this section, because shareholders take on higher risk, they also expect higher returns in return.

In another example, government securities have a lower risk against corporate bonds, since the security of our capital depends on a state’s ability to repay us, compared to this companies carry more risk.

Of course, there are exceptions to this. An Apple bond is much safer than, say, a Ugandan government bond. This is because smaller countries carry more risk. 

High Yield, Low Risk?

A recurring question you may sometimes hear, or even ask yourself is; “How can I get a high return with low-risk exposure?”

Unfortunately, there isn’t such a thing, at this moment in time, that can be utilised.

If there were, it would be an arbitrage situation that investors would understandably take advantage of very quickly and so it would disappear in the blink of an eye.

For example, imagine an extreme situation in which the yield of an almost risk-free government bond is higher than the yield of a stock, which carries a much higher risk; 

Institutional investors (whose thousands of employees and computer algorithms constantly monitor the market) would immediately start buying government securities, as it has become quite attractive compared to other investment opportunities. This would increase the demand for government securities and therefore the price.

A higher price would simultaneously mean a lower yield, thus correcting the yield on government securities to the point where it reflects its risk. 

So if you want to get a high return, you have to take a higher risk.

3. Diversification

While the risk of investing cannot be completely eradicated, it can be reduced by avoiding unnecessary risk.

You may have heard the saying, “Don’t put all your eggs in one basket.” This is very relevant here.

Many people make the mistake of investing all their money in one particular company’s shares. If you were to do this, and something happened to your chosen company, you could lose a lot of money or even potentially lose all of your invested money.

Think in Portfolio

Instead of individual stocks or bonds, you may want to consider a portfolio that is more broad and diversify your investments across different asset classes.

This will make the performance of your portfolio less dependent on the performance of a single asset class, which will:

  • Reduce the risk of your investments
  • Increase the return on your entire portfolio
  • With a well-diversified portfolio, you can achieve a much more favourable return-to-risk ratio.

As we have already seen, each asset class has its own unique feature and they each have an individual reaction to different market changes.

In general, where one asset class performs poorly, another will moderate or offset it.

Example: In times of crisis, when stocks tend to fall sharply, bonds can provide security, thus balancing the performance of your portfolio.

Not only should you just diversify between asset classes, but it would be beneficial to at least consider diversifying the products bought from within the same asset class.

Example: Instead of just one company, you can invest in many multiples, allowing you to spread your risk a lot more.

As you can see, you can diversify on three levels:

  • Between asset classes
  • Within asset class between different, individual investments
  • Between different regions and industries

ETFs: One of the Best Tools for Diversification

The following question is a great one, not to mention reasonable to ask:

“I don’t have the money to buy hundreds of shares. In fact, I don’t have the time or knowledge to properly manage them. What should I do?”

There is a saying about finding a needle in a haystack. There is also a continuation to it which says, “Instead of looking for the needle in the haystack, buy the whole haystack instead”

With ETFs you can buy the whole haystack, figuratively speaking anyway.

With a single purchase you can buy into hundreds or even thousands of shares for any amount you can put aside. Minimum amount can vary platform by platform on eToro you can start investing from $10

Investment Concept: Summary

We’ve all heard that we should invest, but many people don’t start. Many are held back by the potential investment risks.

Investments can be risky, but if you invest according to a well thought out investment strategy, you can reduce these risks and have a fairly higher degree of certainty that you won’t lose as much as someone who doesn’t have a set strategy.

Don’t forget because of inflation, if you don’t invest, you are guaranteed to experience some form of a loss.

So therefore investing remains the most beneficial way to achieve your long-term financial goals of building wealth.

While investing may seem complicated at first, with proper research, it will surely become a lot more simplistic and can show good returns.

Have you invested before? Or perhaps you are currently studying and plan to invest in the future?

Whichever situation you are in, we hope that we have been able to cut the jargon for you by clarifying the truths of investing.

Please understand that NO information in this article should be considered investment advice and should only be used as a guideline.

BEST INVESTMENT SINCE 1927: SMALL VALUE SHARES

Our article will look at which shares would have made us the most profit if we had bought them between 1927 and 2019. We will talk about the so-called small cap stocks and discuss how much these stocks outperformed the U.S. stock index, the S&P 500.

We will also talk about how much differently these stocks have performed over the past decade and how well this could mean small value stocks may perform in the future.

Our topics:

  • What was the result of small value investment between 1927 and 2019?
  • What does small value stock mean?
  • Value-glamour anomaly in the stock market
  • How value shares outperform periodically

What was the result of small value investment between 1927 and 2019?

If we look at the yield on small value shares in Professor Kenneth French’s Research Portfolios database, we find that the annualised return on small value shares was 14.5% between 1927 and 2019. Meaning small value stocks outperformed the S&P 500 index by 4-5% annually, with a yield of 10.2% in the same period. So you could say that small value stocks have been the best investments in the U.S. stock market for the last 80 to 90 years, but over the last decade, the value factor has underperformed the stock market, which affects small value stocks well.

The problem with the above comparison is that we compare stock indices. Still, we cannot invest directly in stock indexes, so we get a more accurate picture when comparing specific investment products. For this purpose, I raised the Vanguard Fund Management S&P 500 Index (VOO) (VFINX) and the VB (DFA) US Small Cap Value etf.

The graph below clearly shows that the small value portfolio (11.37%) outperforms the S&P 500 index (8.03%) between 1994 and 2012.

small value shares

But after 2012, small value stocks (10.85%) are lagging, with the S&P 500 index outperforming by 14.73%.

However over the past decade, small value stocks – and practically the value factor – have diminished the stock market’s impact. We have considered the possible causes of this change, so let’s look at what small value shares mean.

What does small value stock mean?

A ‘small value share’ is a term for any shares with a low market capitalisation, i.e. small companies, and are underpriced based on various fundamental indicators (e.g. P/E – Price-to-Earnings ratio, P/B – Price-to-Book ratio, P/S – Price-to-Sales ratio, P/FCF – Price-to-Free Cash Flow). Investors are actually exploiting two stock market anomalies by investing in value shares; because one only invests due to the size factor, i.e. low-cap stocks have a premium yield.

Between 1927 and 2010, the average annual return on shares with the largest market capitalisation was 10%, while the average yearly return on shares with the smallest market capitalisation was 21.26%. When the U.S. stock market was split into ten different parts. This defined the largest and smallest stock categories, according to their level of capitalisation.

The smallest category of shares became the lower deciles. In contrast, the largest market capitalisation became the upper decile, meaning this group is the top 10% of shares with the largest market capitalisation. But this anomaly is observed not only in the case of shares with the most and least significant market capitalisation but continuously it has been shown that those with smaller caps can make a higher possible yield; see picture below.

For example, the 50% of shares with the smallest capitalisation would show an average annual return of 17.24%, if the value of all U.S. stock was to be halved. In contrast, the 50% of shares with the highest capitalisation would only offer a return of 13.32%.

The other is the value factor, i.e. purchasing underpriced shares on the basis that their future value will out-perform. This value factor is based on well-known investors, such as Warren Buffett’s investment methods, but backtesting has shown that the value factor is a common element even in long or short techniques.

However, the problem is that the impact of the value factor has diminished over the past decade. As a result, some indicators may no longer achieve any additional returns (yields that outperform the S&P 500 index), but some other indicators still prove effective. In any case, these are the reasons behind newspaper articles in which you read that Warren Buffett’s method of investing, or value-based investing, has failed, it is not working.

Value-glamour anomaly in the stock market

The truth is that different premiums on the stock exchanges have changed over time. As an example, let’s mention the most well-known premium, the risk premium of the stock market, which also forms the basis of the CAPM (capital Asset Pricing Model) and shows a decades-old correlation, i.e. investors receive a return premium in exchange for equity market risk. This yield premium averages 8.24%, and at a stat value higher than 2 (3.91), indicating a statistically significant result. This is a robust, significant observation, and the value factor is similar.

However, in the case of the risk premium, we also find that it is not always positive. We will use the following periods: 1929 – 1943, 1966 – 1982, and 2000 – 2012 to highlight this. In all of these periods, the risk premium of the stock market was negative – the S&P 500 index would have given you a lower return than risk-free investments would have done. Let’s also discuss that, if we take an even more comprehensive retrospective look, there have been several negative risk premiums in the past.

As you can see, not so long ago,the risk premium was negative  in periods of 10-12 years, therefore the fact that the value premium has been negative for the same length of time, is a trend more than it is a surprise. The presence of this extended period isn’t a surprise, simply because stock markets have longer cycles, but as you can see in the graph above, the value premium averages 4.7% per annum.

We have also talked about the reasons behind the underperformance of value shares, and in this article the so-called value-glamour anomaly also appears, i.e. popular growth shares (glamour) underperform the shares selected based on their longterm value, but it is still possible that growth shares can outperform in the short term.

Value shares outperform periodically

It is worth being aware that the returns available on the stock market and stocks also change over time, so while it sounds reasonable that the yield of the S&P 500 index is 10% per year, this average is calculated over a period of 90-years. Over a shorter investment horizon (e.g. 5-10 years), yields are significantly spread relative to the average, depending on valuation.

The graph below shows the P/E ratio (Price-to-Earnings ratio) of the S&P 500 index over the past 25 years. Over the past 25 years, the average P/E of the S&P 500 index has been 16.39. The graph also shows the boundary of single standard deviation (13.24 and 19.54) with dashed lines, i.e. assuming a normal distribution, the P/E ratio moves in the range 13.24 to 19.54 for 67 per cent of the period. And if the P/E rate leaves this band, we will see a level of appreciation that is relatively rare (33% of the time).

If we look at the double standard deviation, the P/E ratio varied between 10.63 and 23.23 in 95 per cent of the period.This means that above 23.23 (now 21.72), we will witness a rare event with a probability of 5% based on data from the last 25 years.

The problem is that a high P/E ratio predicts low future returns. For example, in the photo below, you can see the 1-year forecast. The descending yellow line shows that with the increase in the P/E ratio (on the X axis), the available annual yield falls (Y axis). The problem is that the standard deviation of the data is substantial. In some years, yields are very far from the yellow curve, i.e. the indicator is unsuitable for an annual forecast (the correlation factor of 9% indicates this).

In the case of forecasting five-year annualised yields, the forecast is much more accurate. The standard deviation of the data is smaller, but this also shows us the above correlation. Or a more accurate (80% correlation factor) is the Shiller P/E ratio.

The essence of the above is that the rise in the stock market is typically driven by growth shares, so value shares underperform in the mature phases of a bull market when it comes to the stock market. You can see an example of this in the graph below, where you can see an index in yellow showing the largest 1,000 growth companies in the U.S. stock market. In grey, is the most sizeable price of 1,000 value shares.

It can be clearly seen in the picture above that in the bull market preceding the dotcom bubble, growth shares outperform significantly, and then by the end of the crisis, they fall back to the same level as value shares. This is followed by the period when value stocks begin to outperform.

And then, over the past 10 years, growth stocks have outperformed strongly, and the gap will widen spectacularly after 2015. At present, the P/E ratio increase correlates with growth shares’ price increasing.

And if we compare the valuation of value and growth shares, we can see a similar situation. In the picture below, you can see that before the dotcom bubble (2000), growth shares will become more and more expensive fundamentally (downward curve). Then the valuation of growth shares will again approach reality (falling prices on the stock exchanges, this will improve the P/E ratio). However, over the past five years, we have seen that growth shares have become more and more overpriced, when compared to value shares (the curve is falling).

Therefore, we have seen that growth shares outperform value shares over time in certain periods. However, over more extended periods, value shares usually outperform. There are also logical reasons for the overperformance of growth stocks; think of the irrational behaviour of some investors in the stock market. Even in longer periods of time, momentum drives up prices, but this results in an overpriced situation (and in-turn predicts lower future returns).

The bad news for investors is that such overpriced situations can persist for years, and as previous examples show, there’s nothing special about an effect not working on stock markets over a 10-year horizon. Of course, small value and value shares may outperform again sooner or later, but this will have to wait.

The topics that we have/will cover are: stock market trading, stock market investing, correlations that could result in additional ROI, facts and misconceptions about the Stock Exchange and stock market anomalies, as well as many more!

Before considering investing in small-cap stocks you should do your own research (DYOR) on them. To help get you started, we have found a great article that will bring you some extra knowledge.

Read more from Us

Risk Management for Forex and CFD Trading

Risk Management for Forex

Learn the best risk management practices for successful Forex and CFD trading.

In order to trade Forex and CFDs, leverage is needed, and it can greatly multiply your profits. Due to the risk associated with leverage, though, your losses can be significantly increased too. The higher the potential profit, the greater the risk, so it is a prerequisite for your subsequent trading to understand the risks of leveraged trading. Your guide to Risk Management for Forex and CFD Trading.

As we said, Forex trading does have high risk. Thankfully, in many ways, you can lessen this.

This article will guide you through the basics of applying risk management strategies. Please note that this is not financial advice, and we are merely providing an informative resource for you to educate yourself on this topic further.

What Does Risk Management Mean?

General trading risks

Your profit opportunities are always closely correlated to market risk.

Think of risk management as a package of assets and activities that you can use to keep your losses low and potentially increase your profits.

Risk management in Forex trading is based on the following four fundamentals:

  • Identifying the risks of Forex
  • The analysis and assessment of these risks
  • Solving ways to reduce the level of risk
  • Consistently using these solutions with careful management and consistent utility

Examining markets is a priority for both novice and experienced traders alike. Finding a good market “entry” is vital. However, this doesn’t lessen the value of risk management has, for professional and new traders alike.

We also wrote an article about market risk specifically click HERE to read it

Leverage effect

Most people choose Forex and CFD trading because of the possibility of leverage. Why? Because with leverage, we’re going to have a much smaller margin requirement, with less capital – this helps produce a more significant profit margin.

REMEMBER; If the market doesn’t go your way, you could lose a lot more!

The more leverage you use, the faster you can win or lose. For example, there is a chance that you could choose leverage higher than you can handle. If this were to happen, it could cause you to no longer manage your assets sufficiently, potentially causing losses. Less leverage can be an attractive option to reduce your risks, but, at the same time, any potential profits would deflate because of it. Therefore, it is worth carefully considering the degree of leverage you have.

Incorrect market valuation

Trading Forex pairs, CFDs begins by deducting spread costs (difference in buy and sell price). Immediately after opening the position, there will be a negative value in your profit column. You should be aware that your trade will not always be profitable. It doesn’t matter how much you lose. To keep losses within reasonable limits, you should set a stop loss. However, remember that setting the “stop-loss” too narrow will mean your position may be closed even with minimal market movements.

Remember, not all positions will close in the green (profitably).

Rapid market movements

The market continuously moves because of news, opinions, trends, and political decisions. 

For example:

  • Suppose a central bank announces that it is changing the interest rate. In that case, this suddenly causes considerable movements in the markets, and significant gaps (breaks) in the exchange rate may appear very quickly.
  • A prominent market participant may intentionally cause market ‘pain’, generating a significant downward shift by liquidating specific, more prominent positions.

Sometimes there may be unexpected market movements. Even if you feel like you are constantly watching what is happening, you can never know precisely what will happen in the next few minutes.

What do we suggest for that? 

You may want to use automatic tool systems, such as stop-loss and take profit parameters, to close your positions on time for you. However, it is essential to know that inputting a stop loss does not promise to eradicate the possibility of loss completely; it can only limit how much loss you can suffer.

Market gaps 

Suddenly the exchange rate jumps, which is clearly evident on the chart.

A gap usually occurs after the market closes, but there are situations when the exchange rate reacts to unexpected economic news or events in the case of an open market.

Why is this important? If such an open market gap is created, the set stop loss and take profit levels will only be executed with the closest exchange rate available. An example on the EUR/USD graph:

  • An unusually large weekend gap emerged on this chart
  • There is no bid/ask within the gap, which means that the stop loss placed is only triggered at the nearest exchange rate after the gap.
Risk Management for Forex

The presented gap on the chart shows a negative slide in Forex Trading rules. But, of course, there is also an example where slippage can result in a higher return for the client, since the profit taking has been achieved in a more favourable place.

Risk management tools

Stop loss – know your limits

Prices can move very quickly, especially if the market in a period of volatility or nervousness. Therefore, a well-placed stop loss “reacts” much faster than any manual trader would be able to react, making it one of your most serious risk management tools. 

Countless articles and articles have been written about choosing the proper stop loss, but there is no golden rule that can apply to all traders and their different trades. The appropriate stop loss location for each trade must be determined separately by answering the following questions.

  • What is your trading timeline (just know – for a longer-term position, there may be more volatility)?
  • What is the target price, and when can we expect to reach it?
  • What type of account do I have, and what balance do I have on my current account?
  • Do I currently have any open positions in the market?
  • Is my position size appropriate for my account size, balance, trading timeline, and market situation?
  • What is the general market sentiment (volatility, liquidity, news, external factors)?
  • How long is the market open (e.g. is the weekend is approaching or when will the market closing be happening in the evening)?

Since there is no general rule on setting up a stop-loss, we recommend using a free demo account so that you can learn to get to grips with proper implementation without any real risk happening to you. Here are some trading examples of different stop loss uses. If you have a real account, you can use MT4’s extended trading features in the same way, which displays the risks associated with each stop loss in the specified currency.

Position size

Even the best of traders can experience non-profitable positions. For example, ending with 5-8 out of 10 trades positive is considered a successful ratio in Forex Trading. Therefore, a well-chosen position size is critical to get through any market movement.

Select leverage

As you already know, too much leverage can increase your risk, and even a few negative trades can ruin your good results. So, we want to remind you:

  • To choose the right level of Forex leverage for you, and don’t get in over your head.
  • use our trading calculator in MT4 Supreme or on our website to see different trading situations, which will help you later choose the right position size for your live trading.

External factors

Keep in mind that several external factors can affect your trading strategy on Forex. Such factors:

  • power outage and/or internet connection problem
  • you are busy or hijacked by office work.

Try our trading calculator to practice different trade scenarios.

 (Try the trading calculator)

Be aware of the picture as a whole

Forex and CFD trading can provide substantial profit opportunities when buying or selling. But remember, it can also cause losses if you don’t practice and learn risk management. Identify your weaknesses and manage them. This will be what will help control your losses – even if you have 8-10 winning trades, just one single losing trade can absorb all of those profits.

We know that the psychological factor in a loss-making trade can discourage many novice traders. But it is essential to understand that loss is part of trading. So, before you start your first live trade, understand:

  • Losses are inevitable
  • And know how to process them psychologically before they happen.

This guide is intended to facilitate the trader’s risk management with descriptions and examples. As well as what tips we offer, we ask that you do these two things:

  • Keep this fundamental information in mind as you improve your personal risk management strategy
  • Understand that the information we have provided here will only help you to limit your losses – it will not solve them.

But listen, remember, Forex and CFD trading isn’t Heaven and Hell itself. You can significantly improve your profit/loss ratio for successful trading by selecting the correct risk management methods and applying them consistently.

You can try Forex trading risk free with a demo account. There are many brokers out there that we could recommend, one of which being Etoro.

Read more from Us

Top 10 Forex, Stock Market and Money Management Tips for Beginners

Top 10 forex tips

To help you better prepare for the world of Forex Trading, we have put together our top Forex money management tips, which you will find below.

As always, in order to be successful in trading, you need to have a complete, and carefully thought-out trading plan. A good trading plan will tell you when to enter a trade, when to close that trade, which currency pair to trade, and how to manage your money overall. As you can probably tell from this, the forex money management strategy is vital, but it is a small part of a much bigger picture.

Stock Market Tips – Money Management Tips

Our Stock market tips (basically investment tips) are not placed in order of weight and are equally just as important as each other. Don’t feel like you can only read through this once, if you do need to go through multiple times it doesn’t make you any less of a trader.

If you feel the need to, browse through the list several times to learn each one properly so you can then know how to best implement them into your own trading strategy. If that is what you wish to do of course!

1. Quantify your risk capital

In many respects, this is one of the keys to forex money management strategies. For example, the size of your total venture capital may be a determining function of the maximum size of your position.

You should know that within any single trade, you should never risk more than 2% of your total capital.

2. Avoid trading too aggressively

Trading too aggressively is probably the biggest mistake that beginners will make. If a shorter losing streak is enough to grind down most of your capital, it shows that you’ve taken too much risk in each trade.

One way to set yourself the right risk is to choose the size of your position based on the volatility of each pair. Remember, a very agile couple requires a smaller position than a less volatile companion.

3. Be realistic

One reason new traders are too aggressive is that their expectations are unrealistic. They believe that aggressive trading will help them get rich quickly. It’s important to always have reservations about the investment tips you read online, as what works for someone else may not work for you.

The best traders are constantly making returns on their money, however realistic goals and a more conservative approach are the right way to start trading.

money management tips

4. Admit if you’re wrong

The golden rule of trading is basically to just let your profits run and to, of course, cut your losses in time. It’s essential that you quit quickly if there’s clear evidence that you’ve entered into a bad trade. It’s a natural human instinct to try to turn a flawed situation around and change it for the better, but in FX trading this would be a huge mistake.

Why? Simply because you can’t control the market. 

5. Prepare for the worst

We don’t know the future of the markets, but there’s plenty of historical evidence. It will not be repeated again, but it shows what patterns and trends have formed over time. That’s why it’s important to also look at the past behavior of the pair you’re trading on the charts.

Think about what steps you should take to protect yourself, for example, don’t underestimate accidental price shocks. Being in a very unfavorable price move is not a misfortune – it’s a natural part of trading. So you have to have a plan for these extraordinary situations. You don’t have to go too far in the past to find an example of a price shock. In January 2015, the value of the Swiss franc increased by around 30 % against the euro in a matter of minutes.

6. Set exit points before you enter a position

Think about what goals you want to set for profit and how much of a loss you’d be willing to accept, should it go the other way. This will help maintain your discipline in the heat of trading. Also, it emboldens you to think more about the risk-return ratio.

7. Use some kind of stop loss type

Stop-losses will help keep your losses low, and they’re especially useful when you can’t keep an eye on the market all the time. If nothing else, at least use a mental stop-loss i.e. A mental note of the lowest point of loss you’d be willing to accept, at which point you no longer want to risk new trades. Price alerts can also be very useful.

You can also set up notifications for MetaTrader 4, for example

8. Don’t trade out of a sudden agitation

At some point, you might make a massive loss and even lose a significant portion of your entire capital. As we mentioned earlier, here you will be tempted to try to recover all the losses in one trade.

The problem with this though, is if you increase the risk when your capital is already in trouble, the worse the potential position that you could end up in. This is a Forex tip you should definitely take heed of.

Instead, reduce your exposure to losing positions or wait a while until you find a really clear new sign. Always stay in balance, both mentally and in terms of the size of your positions – this perhaps one of the most important tips on Forex money management strategies.

9. Respect and understand leverage

Leverage allows you to take a much larger position than your true capital would allow, but of course it also increases your potential risk in the same way. It is very important to understand the size of your total exposure.

10. Think long term

It goes without saying that the success or failure of a trading system will manifest itself more so in the long run than it will in the short term. With this in mind, be careful not to attach too much importance to the success or loss of a trade. Don’t make exceptions by changing or ignoring the rules of your usual system just to make sure your current trade is going well.

Whilst reading our Forex, Money Management and Stock Market Tips for Beginners please bear in mind that, Like all aspects of trading, the acceptance of investment tips purely depends on the preferences of the individual. However, when presenting the above stock market tips, we tried to be able to advise in such a way that would be found useful by a wide range of traders.

We would also like to point out that some traders are able to endure higher risks than others. But if you’re a novice trader, no matter who you are, we recommend you start out more conservatively.

Read more from Us

What is market risk? Complete Guide

bear

When a market bear strikes it’s practically impossible to gather enough time to grieve your losses.

Without market risk, there is no investment. If someone misjudges the dangers of a market bear, they might as well lose everything. That is what we saw in the financial crisis of 2008, and it is still the case today if one holds himself to account. When a small investor does this, it’s unpleasant, but if it’s a big bank, it can be a disaster. Market risk is one of the biggest financial risks and we are here to help you understand the basics. We’ll go through exactly what it means and how it’s generated. The focus of our article is on banks, showing how they quantify this threat and what regulations apply to them.

The Bear

The period 2007-09 taught many that the market bear is no spoof or joke. When stock market prices and OTC fell like dominoes, the world turned upside down. But it doesn’t even take a financial crisis to burn ourselves with bad exposure. Market risks can come in many forms, and often very unexpectedly. This was the case, for example, with retail foreign currency loans (with a debtor’s eye), where masses went into credit transactions without knowing the existence of foreign exchange risk. It was a painful lesson for many.

“Of course, it wasn’t just the public who were wrong at the time, it was the banks and regulators,” he said. Indeed, in the great financial crisis, it turned out that market risks were being measured inaccurately and were poorly regulated.

In this article, we will now continue on the topic of financial risks and deal with the measurement and regulation of threats arising from market movements after credit risk. Again, we are doing this from a banking point of view, as these are the protagonists of the financial world. Plus, it is the banks who are most likely to be able to manage market risks well, because if they do not, they would put our money at risk.

What is the risk here?

Let’s start with a tour of the concept. Market risk involves an adverse change in the exchange rate or implied volatility of financial products. Simply put, it seeks to capture the risk of loss due to the entire market or specific market exposure. It is no coincidence that we are wording a little carefully here. This is because the literature divides market risk into two main components; The first is general market risk, which includes the risks specific to the market as a whole. This risk cannot be diversified, although it can be protected against it by using special cover techniques. A good example is when stock market indices all start to fall in the market, and even though we keep a lot of different stocks in our portfolio, we still suffer losses.

https://www.bis.org/publ/bcbs159.pdfThe other component is the specific (unique) risk associated with the closer product, such as a particular share or a specific bond issuer. This is already a diversifiable risk, but there is not always a business need to defend ourselves against it. It is worth noting that there is even some credit risk and migration risk deep in the market risk, as we give and take shares with great intensity in vain if their issuer suddenly goes bankrupt or their credit rating changes. In such cases, a serious loss can always arise. This was therefore particularly taken into account in banking regulation when a framework for market risks was developed; For example, the IRC calculation was born, which in English stands for Incremental Risk Charge.

Market risk may arise in many cases, but regulation focuses mainly on financial products held for trading purposes. The basic premise behind this is that if we keep something in our book until maturity, not for trading reasons, then it is worth applying the credit risk framework there. After all, it basically doesn’t matter how, for example, a bond’s price develops when coupons are paid out without any problems and the transaction expires without any problems.

The area of ​​market risk should therefore be narrowed.  The Basel guidelines state that all fixed income and equity exposures in banks’ trading books should be included.  Moreover, we also include foreign exchange and commodity exposures in the bank’s complete Trading and Banking Book.  Due to the latter, it is otherwise quite rare for a banking business mix where there would be no market risk and no RWA or capital reserves would have to be created for it.  Even if the bank does not have a trading book anyway.

What is a bank doing on the market?

To understand the topic, let’s get a little more into what this aforementioned ‘trading book’ means. To do this we will take a closer look at what banks are doing on the market, which exposes them to market risk and special regulation.

In addition to their role as money creators and creditors, banks occupy a key position in financial market and capital market intermediation. It would be reasonable to say that they are the selling side of the market, because in many cases it is really thanks to them that some products and securities have a market at all. In OTC markets, such as the foreign exchange market, banks play a decisive role and without them we would live in a completely different world. But there are a lot of misunderstandings and malicious assumptions about what exactly a bank does on these fronts.

With our previous statement in mind, we find it important to remind you to not forget that the market presence of banks is not focused on speculation, but on mediation and the provision of services.

U.S. big banks have also been banned from trading their own accounts (proprietary trading) by adopting the Volcker rule. This type of activity has not completely disappeared from the banking world, but a significant transformation has taken place. From the global big bank, these divisions, as well as the star investors working there, have emerged and established hedge funds. Thus, in this form, own-account trading has not been lost on the economy, only the circle of risk-bearers has been transformed. The latter is therefore correct, as Paul Volcker and other prominent economists have argued.

Even if international banks no longer take market positions for their own gains, they will still remain very active in the market due to customer needs. This is because of the so-called market making and brokerage activities.

This is in reference to when the bank’s traders trade or hold securities to meet customer needs. For example, a customer can ask the bank to acquire XYZ’s hard-to-buy shares on the OTC market. Or the bank may decide to buy in advance from that XYZ paper due to expected customer needs. Moreover, you can build such large portfolios from such securities that your clients can then sell and buy at any time.

In the case of the former two, the bank receives revenue from a certain percentage of the transaction fee, and in the latter line-up it makes a profit on the difference between the buying and selling rates

From this we can see that a bank doesn’t play directly to make exchange rate gains on securities, but it still exposes itself to market risks in the same way.

This is a typical business setup for banks, and is what can lead investment banks to face very significant market risks.

The rules of market risk

It is of the utmost importance, both for the well-understood interests of the bank and for the regulator, to quantify these risks. Unfortunately, the financial crisis of 2008 highlighted the lack of a Basel 2 framework, which was ironically designed for this purpose.

In response, the so-called Basel 2.5 guidelines were established as a rapid remedy in July of  2009, which significantly increased the capital requirement for market risks. But that wasn’t enough. So, in 2012 a thorough rethinking of market risks began, which the industry called the FRTB (fundamental review of the trading book).  This comprehensive study transformed both the standardized approach to market risk and its quantification with internal models.

Banking regulation never happens overnight, it often takes years for impact assessments to be carried out. In addition, the banking sector will still need to be consulted afterwards, and individual states will have to legislate. Moreover, after that, banks even need time to prepare and adapt. It’s understandably not easy as any substantial change here will always take years to be considered to be a positive success.

Thus, it is not surprising that four years after the start of FRTB consultations, the framework had only just been re-amended in 2016. Nor is it that the rules need to be further refined, and in 2019 the Basel Committee on Banking Supervision (BCBS) announced new changes. This latest guideline finalised only Basel 3, the European introduction of which has only just been discussed with CRR2.

In short, it was a long birth by the time the market risk framework was born, which we can read today and which is intended to ‘finally’ address the lessons of the financial crisis.

market risk

How does this system work?

We cannot compress all of the countless essential points of the market framework into just one article, but we have summarized its most important pillars and the risk measurement is explained a little better below.

As with credit risk, the starting point for measuring market risk is that banks either use their own model to calculate risk-weighted assets (RWA) or follow a standardized approach.  Here again, the idea is that through their own internal models, banks will be able to assess actual risks more accurately, as they only really know their products and they can see up close what losses their market business has suffered in the past.  At the same time, the regulator needs to set minimum requirements for models and or modeling to make it work well. The standard method should be a credible basic method at all times, where the risk from each product is quantified with sufficient sensitivity.

However, in addition to defining the methodology, the regulator should also address other issues. A key issue is that the bank correctly defines the actual range of products (the trading book) that fall under the market framework. The possibility of the bank abusing the classification should be excluded from the possibility of artificially lower capital requirements. The latest regulation therefore strictly stipulates this, and if one exposure is transferred from one book to another – say, from trading to banking – then the bank should not have a reduced capital requirement.

Finally, it is even necessary to regulate when banks’ models perform reasonably in measuring risks. This is also a part of the market framework that has received considerable attention in recent years, as many models failed in the 2008 crisis.

The four themes are the cornerstones of the market risk framework. Themes are as follows; Internal model measurement, standard method measurement, model validation, and the definition of the trading book.

In this article we will go deeper just into the topic of risk measurement. In particular, we only look at the basics of the most common VaR-based modeling. This method is a very nice and relatively new scientific direction in quantifying risks. There are problems with this, of course, which the regulators have discovered. These will be discussed and summarized in the remainder of this article..

Modeling market risk

The so-called Internal Modeling Approach (IMA in the literature) is currently based mainly on various applications of VaR (Value-at-Risk). This is about trying to estimate the frequency of the distribution of gains and losses (P&L) and then shooting the risk profile of a product or portfolio based on the area under the curve.  In this way, it is possible to say the probability of a given loss occurring in the examined period.

Looking at a portfolio, we can say what is the maximum probable loss we can have in the coming days or months.  If, for example, the 30-day 1% VaR is usd 10 million, this means that we have a 1% chance of making a larger loss in one month.  On the other hand, out of 100, we will only face a loss of less than 10 million in 99 months.  This value of 10 million can be obtained by estimating the density function of a given portfolio, from which the value at 1% can be obtained directly.

VaR is an extremely popular and very widely used method of assessing the maximum loss that can be made in a bad month, with a given confidence in the results.

There are several ways to model a risk value, but three main groups can be identified. The simplest variety is the variance-covariance method, for which it is enough to estimate the average change and standard deviation. Much more work is needed by the historical method, which reconstructs the actual distribution of gains and losses from past data. The most complex method is the Monte Carlo simulation, in which a separate model is responsible for future outputs, such as a share price. This really has an advantage if we can really capture the characteristics of a product’s exchange rate turf and simulate it by simulating it to generate a P&L distribution that is more authentic than the historical method.

This is no easy task so, unsurprisingly, the vast majority of banks follow the Historical VaR Approach.

The regulator, on the other hand, can penalise inaccurate models by setting VaR multiplication factors, thus encouraging banks to choose the best possible solution. How successful this is in practice is already the subject of a separate professional debate.

VaR calculation, regardless of what method you choose, has several limitations. One of the most important is that if we do not have enough information about a financial product, we cannot monitor its price regularly – therefore it cannot be modeled properly. When this is the case, VaR calculations are not actually able to capture market risk well.

The other problem stems from the realisation that market losses have a particularly cruel nature. The edge of loss distributions often crept upwards, that is, it does not behave according to the normal distribution. This means that very large losses are not necessarily so rare, but it is very difficult to see. The VaR calculations used in practice can easily underestimate the value actually at risk, and the 2008 financial crisis was a disrepute example of this.

The banking industry has come up with several ideas to compensate for this. For example, it has invented the stressed VaR calculation (SVaR), which calibrates the quantification of risks to adverse market conditions, thereby helping to define the overall market RWA and capital requirement more accurately (and higher).

But the latest regulatory approach goes beyond that and introduces the so-called conditioning VaR (CVaR), commonly referred to in the industry as ES (Expected Shortfall). The essence of this is to try to capture the average of the margin of loss distribution. So while the VaR of 1% says that the worst 1% of the distribution has a limit of this size, the ES tells us how much loss is generated on average in the area below the 0% and 1% curves. If there are good high values at the very edge, then the ES will significantly estimate a higher risk than VaR. This solves a major shortcoming of previous VaR modelling practices.

The important difference between the VaR and ES methods is how it captures the edge of the distribution. Source: Bank for International Settlements

Basel 3 – The end of a long journey

Market risk regulation is no longer content with banks meeting the regulatory requirements once their internal models are introduced. Instead, the BCBS recommendation requires continuous retesting of models (This is known as a backtest requirement).

As soon as the supervisor finds that the model used in one of a bank’s trading business is not performing well, i.e. the estimated losses are significantly below the realised level, it may suspend the model use licence. In this case, the bank should return to the standard method, which usually leads to a higher capital requirement.

But the regulator doesn’t even stop there. Under the new recommendations, the difference in capital requirements resulting from internal models and the standard method will be increasingly limited. This will eliminate the need for VaR or newer ES model variants to underestimate market risk and thus reduce the capital that is trained on it.

If we had known the interpretation, the measurement method and the regulatory method, as described above, before the financial crisis happened, we would probably be a few steps further ahead.

However, the problem of measuring and regulating market risks is very likely that the finalisation of Basel 3 (which many people from within the banking industry are already calling Basel 4) is not over. Financial products have evolved enormously over the last few decades and we have seen a new face of market risks in the last few crises.

It is almost impossible that, as financial innovations progress, there will be no need to further clarify the practice of measuring market risks and the related banking regulations. Of course, it’s also a big deal that we’ve come this far, and the banks have become much safer.

Read more from Us

A Complete Guide to Short Selling

What short selling is and everything else

The topics that we will cover in this article are: How can each of us play our part in an exchange rate decrease; What is short selling as a general concept; What are the rules of short selling; As well as how possible it would be to shorten the market.

Surely you have heard the phrase that speculators shortened or, in other words, briefly sold a currency, a stock, and specifically mortgage-backed securities – like those shown in The Big Short. A 2016 film that highlighted the dark pits of the modern financial world was led by Director Adam Mckay.

It is likely that this negative-sounding news is causing short deals to be embedded in the back of people’s minds.  At first glance, it may not be clear, and even a little alien, but it is possible to profit from a depreciation.  In what follows, we show that without shorting, not only would the cinema world be poorer by one great film, but that shorting is one of the defining gears of the entire capital market machinery.

If we interviewed people about the nature of the profits made in trading, the vast majority would buy cheaply to then sell more expensively and enjoy the profit generated by the exchange rate inflation. 

There is also a gap in this, because in the long term, when at this with a perspective of 20 or 30 year, stock prices will generally tend to creep upwards on the chart.    

But what if we think the price of a product is skyrocketing or massively overpriced and will soon fall?

You don’t have to be a stock market magnate to realize that rising and falling exchange rates are constantly following each other. If the market rises, the rising waves are longer, and in the case of bear markets, it is the other way around. It makes sense to enjoy the downward wave in order to reach cheaper buying prices.

Riding this downward curve is, in essence, what short selling is there to help you to do.

A short position (or short trade/short selling) means speculating on a fall in the price, i.e. generating a profit when the price of the selected product decreases. In the case of short selling, therefore, we start trading with a sale, and the plan is to close it by buying at a lower price in the future.

HOW IS THAT POSSIBLE?

If you open a short position, the brokerage company will lend you the product you want to shorten.  This allows us to sell what we don’t have. Yes, but the borrowed product has to be returned over time, that is, as opposed to a buying position, where you can hold these shares and give them to your grandchildren, you can typically open the selling positions for a shorter term, up to a maximum of a few months. 

short selling
Trading

WHEN WILL THE SHORT POSITION BE PROFITABLE?

A short position started with a sale will be profitable if the price of the instrument decreases, in other words, if I sell and buy it cheaper.

Keep in mind that while your risk for a long position is capped, at worst the company will fail and the exchange rate will be 0. On the other hand, there is virtually unlimited vertical space,  and there is no ceiling to hold back the exchange rate price. For example, the price of Tesla, depreciated by $100 at one point and then was above $1,000 a few months later, which in this case would result in a loss of $900 per share. In the case of short selling, it is therefore essential to focus on the appropriate risk management.

WHAT IS A FUTURES INDEX?

The development of futures trading in the mid-1800s was driven by the need for the producer and the user to be able to sell or buy at pre-fixed prices. In the case of a miller, it is useful to know in advance as early as February how much wheat will cost in July, while it is also an advantage for the producer to know how much revenue he can expect even at the moment of sowing. In this situation, the producer sells, the miller buys the July wheat futures contracts. Actual physical delivery is increasingly rare on the futures market, with the buyer and seller mostly accounting for the difference in exchange rate movements in money.

Futures are concluded by some market participants for so-called hedging and risk reduction purposes. For example, a European export company sells its expected dollar revenue against the euro on time, thus securing the exchange rate for itself in advance.  In the case of futures stock market indices, an investment fund manager may reduce the risk of position by selling stock market index futures without selling existing shares if it fears a market fall.

Similarly, for any regulated market that is traded by any man, speculators give the most of the trading on the Futures Exchange.

The majority of futures market participants therefore simply want to benefit from the exchange rate shift, taking advantage of the fact that futures products can be traded up and down without any restrictions.

Trading a futures product is like anything else, if you expect a rate hike, buy it, if you sell it for a drop, you sell it.  There are four differences from the stock market:

Futures products have an expiration date, upon which the product expires and ceases to exist. There are usually quarterly maturities, so there’s always something new to continue doing business with. The fact that the futures product has an expiration date does not mean that it is not possible to close the position at any time before that date nor is it impossible to open a new one at any time. In the case of futures products, the easiest way is to ride the exchange rate decrease is to open a short position.

For futures products, a unit price shift usually causes a higher profit or loss than for a share. For example, in the case of the E-mini S&P 500, a 1 point shift causes a profit or loss of 50 USD. Futures allow for leveraged trading, i.e. we can take positions that exceed our personal equity. For a disciplined trader who knows the rules of position sizing, leverage is irrelevant. Leveraged trading can easily become Russian roulette, only all six bullets are already in the gun. In the case of futures products, the basic unit of trading is called a contract, so you trade one or more contracts with the Stock Exchange.

Let’s say a few words about short selling on the stock exchange.

Short selling on stock exchanges is not much different from buying positions.

Finally, let’s have a couple of cutting-up terms techniques that will make us the stars of every party next to the nodding pots.

WHAT IS THE DIFFERENCE BETWEEN SHORT SQUEEZE AND SHORT COVERING?

The short squeeze has accelerated the buying surge among short-buyers as a result of a rise in the price of a security. The rise in the stock price is prompting short-time buyers to buy back their short positions and book their losses. This market activity causes a further increase in the price of the security, forcing more short-backs to cover their short positions.

Unlike short squeeze, short-covering means the purchase of securities to cover an open short position. In order to close the short position, traders and investors buy the same amount of shares from the securities they shorten.

Let us give you an example:

Zane will be the name of our character.

If Zane shorts 500 ABC shares at $30 per share, and then the ABC stock price dropped to $10. And if He then covers his short position by buying back 500 ABC shares at $10 per unit. This would earn him $10,000 worth of profit; (($30-$10)*500).

Read more from Us

Send this to a friend